|
Money Matters
STOCK MARKET ROLLER COASTER RIDE: IS IT AN OPPORTUNITY OR A PROBLEM?By MARY LYNNE DAHL, CFP®
February 15, 2016
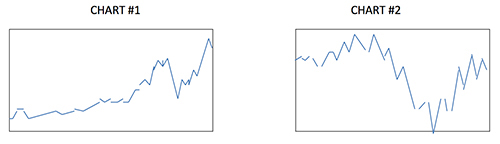
Curbing this instinct to panic and act is hard. You can only do it if you understand the principles of using the volatility of the markets to your advantage. One principle is learning how to focus. Another is to have a common-sense strategy. A third principle is to learn how to harness market volatility to your own advantage. All of these principles will increase your ability to reach your goals. Volatility is the ups and downs of the market. Prices go up, prices go down. This is not new; they always have and always will move up and down. The degree of volatility is not constant, however. Changes in prices can move up or down a lot, or very little; the swings can be extreme or minimal. To understand this better, take a look at two (2) charts that illustrate the ups and downs of the stock market. Answer this question: would you prefer to be invested in the stocks in Chart #1 or in Chart #2?
Chart #1 does not look as volatile and also appears to trend upwards, but Chart #2 looks pretty volatile and ends up back where it started, with no upwards trend at all. Chart #1 is the choice for most people. However, both charts are the same index, but they are for different periods of time. Chart #1 is the 30 years from 1986 to 2016 and Chart #2 is the 6 year period from 2006 to 2012….of the DJIA Index. Investors who sell out during a period of volatility would have missed the overall upward trend of the index and additionally, experienced a loss that could have been avoided. Charts, if not understood, and media headlines, can be misleading. They can cause the reader to feel emotions, like urgency and negativism, and they do it by design, on purpose. Headlines that say things like “Stock Market Tumble Causes Fear and Panic to Spread” will get your attention, which is the goal of that particular media. If they get your attention, you may buy their product. Oftentimes, you will read or hear “forecasts” of what is going to happen next, but these are not always factual. They may be true and they may not be true. Again, they are designed to grab your attention, and they do just that. In addition, if you pay close attention, most “forecasts” are short term. The more short term, the less likely the forecast is to being accurate, in fact. However, it gets a lot of attention. People tend to dislike change. In addition, as humans we are wired to experience more discomfort from a loss than the pleasure we would experience from a gain. Studies confirm this. The negative emotions from a loss of 10% are more powerful than the positive emotions from a gain of 20% for most people. So, markets that swing dramatically expose us to the dual discomforts of unpleasant changes in value and the perceived losses, on paper, of the value of our investments. This is true even though we may not actually realize the loss because it is only on paper. If what you hear and read in the media causes you to change your investment plan, stop and rethink this. Most of what you are reading and hearing will turn out to be wrong. In fact, it was widely forecast that we would have a terrible economic collapse after the stock market crash of October 1987 but just a few years later the stock market was up over 70%. The same thing was true after the 2008 financial crisis; the market was up nearly 45% just 7 years later, in spite of predictions of extreme doom and gloom due to the financial debacle in the US. Historically, most of these forecasts have been wrong, and were intended primarily to sell media to the public. Making financial decisions, such as changing your investment plan and strategy, based on what you see and hear in the media, is dangerous and leads to serious mistakes. Set your goals down on paper and train yourself to focus on these goals. Plan a strategy for investing regularly, through good and bad markets. When the market is volatile, add more money to your plan while prices are down. Don’t be spooked by the ups and downs of the market. Markets move all the time, which you cannot control, but you can control how you respond. Take control and stick with the plan.
©2013 Mary Lynne Dahl, CFP® is a Certified Financial Planner ™ and partner in Otter Creek Partners, a fee-only registered investment advisor firm in Ketchikan, Alaska. These articles are generic in nature, are accepted general guidelines for investment or financial planning and are for educational purposes only. Mary Lynne Dahl©2016 Mary Lynn Dahl can be reached at moneymatters@sitnews.us
E-mail your news, photos
& letters to editor@sitnews.us
|
|||