 by Preston MacDougall March 03, 2005
I've played hockey on indoor rinks, outdoor rinks, flooded backyards, frozen rivers, frozen marshes, tennis courts, drive-ways and cul de sacs. I've also played on the smooth concrete under the rug of indoor soccer arenas. A pair of ice skates isn't a given either. Before the advent of roller-blades, sneakers worked just fine for ball hockey during the off-season.
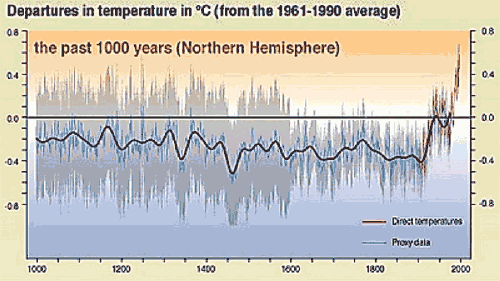
In the winter, when we couldn't be bothered lugging the nets down to the marsh, goal "posts" were made with the itchy wool caps, or tuques, that our mothers made sure were on our heads when we left. (You had to keep an eye on the other goalie, as post-nudging was not unheard of.) No, the only constants in the various forms of Canada's national pastime are the essential rules and the hockey stick. This nostalgia has nothing to do with the rest of my commentary, it's just that I miss hockey. The "hockey stick" in the title is the nickname of a graph of thousands of Northern hemisphere temperature data points over the past 1,000 years. The data are spread above and below a fairly consistent average, until the data begin to "shoot up" at an angle, beginning around 150 years ago, when fossil fuels turbo-charged the engine of the industrial revolution. The best-fit line through the data thus resembles a hockey stick laid on the ground, blade up. Ominously, it looks as though the Earth is going to bake itself. The hockey stick is currently at the center of a face-off between the Kyoto team and the Big Oil team, so to speak. The Kyoto team points to the hockey stick as a "sure signal" of global warming due to greenhouse gas emissions by industrialized countries. The Big Oil team has cried "foul" because it seems that, in this case, it is the data that have been cooked. A Canadian amateur mathematician has demonstrated that the hockey stick data have been "massaged" in a complicated way that tends to make all data look like a hockey stick, even random numbers. His basic claim has been endorsed by a neutral statistician in the Canadian government. Even the US team of researchers that initially published the hockey stick has conceded as much.  One juiced-up statistical analysis shouldn't put an asterisk beside the entire theory upon which the Kyoto Accord was based. It should, however, give pause to anyone pushing an agenda. In hockey lingo, that would be five-minute majors to both teams for fighting, and a two-minute minor to the Kyoto team for using a stick with an illegal curve. This controversy reminds me of a little known lecture by the Nobel prize-winning chemist Irving Langmuir. He was the head chemist at Thomas Edison's General Electric research lab, and was awarded the Nobel prize in 1932 for discovering the remarkable differences when chemical reactions occur in a two-dimensional world. Surface chemistry is now a sub-discipline by itself, and essential for understanding molecular behavior in places ranging from cell membranes to catalytic converters. In a lecture that was recorded on one of Edison's inventions (the rotating wax drum), and only published posthumously (as a transcription), he prophetically coined the term "pathological science." He defined it as "cases where there is no dishonesty involved but where people are tricked into false results by a lack of understanding about what human beings can do to themselves in the way of being led astray by subjective effects, wishful thinking or threshold interactions." Another chemistry Nobel prize is related to the hockey stick: the one given to Svante Arrhenius in 1903. A Swede, and definitely a Great One, Arrhenius won for his theory of electrolytic dissociation, which postulated that when some molecules dissolve in water, they split into electrically charged fragments that he called "ions". His theory was initially greeted with derision, but when applied to acids and bases, he was able to explain, at the molecular level, results of the original litmus test. When chemists talk of "pH", this is based on the measured concentration of a particular ion. Another Arrehenius theory was his "greenhouse effect", which he published in 1896. He sought to explain periodic ice-ages, and proposed that fluctuating levels of different atmospheric gases could significantly affect the Earth's average temperature. He was specifically concerned about levels of carbon dioxide, which were rising with industrialization. This was back in 1896, but it returns us to the present controversy. In science, theories can only be proven wrong, and most eventually are. However, to avoid premature ejection from the game, before going public, scientists should do their best to put their own ideas to the Langmuir litmus test: Am I fooling myself? Did I mention that I miss hockey this year?
Preston MacDougall is a chemistry professor at Middle Tennessee State University. His "Chemical Eye" commentaries are featured in the Arts and Public Affairs portion of the Nashville/Murfreesboro NPR station WMOT (www.wmot.org).
|
||
