 October 24, 2003
The Arctic warming study, appearing in the November 1 issue of the American Meteorological Society's Journal of Climate, shows that compared to the 1980s, most of the Arctic warmed significantly over the last decade, with the biggest temperature increases occurring over North America. 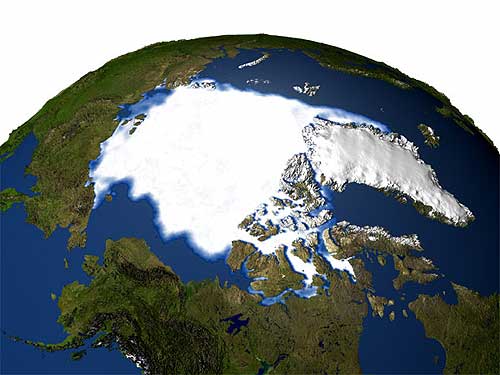 "The new study is unique in that, previously, similar studies made use of data from very few points scattered in various parts of the Arctic region," said the study's author, Dr. Josefino C. Comiso, senior research scientist at NASA's Goddard Space Flight Center, Greenbelt, Md. "These results show the large spatial variability in the trends that only satellite data can provide." Comiso used surface temperatures taken from satellites between 1981 and 2001 in his study. The result has direct connections to NASA-funded studies conducted last year that found perennial, or year-round, sea ice in the Arctic is declining at a rate of nine percent per decade and that in 2002 summer sea ice was at record low levels. Early results indicate this persisted in 2003. Researchers have suspected
loss of Arctic sea ice may be caused by changing atmospheric
pressure patterns over the Arctic that move sea ice around, and
by warming Arctic temperatures that result from greenhouse gas
buildup in the atmosphere. 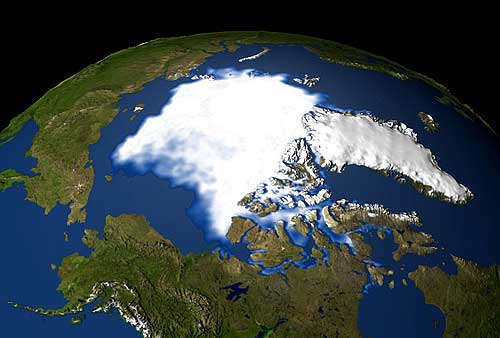 Credit: NASA In related NASA-funded research that observes perennial sea-ice trends, Mark C. Serreze, a scientist at the University of Colorado, Boulder, found that in 2002 the extent of Arctic summer sea ice reached the lowest level in the satellite record, suggesting this is part of a trend. "It appears that the summer 2003 -- if it does not set a new record -- will be very close to the levels of last year," Serreze said. "In other words, we have not seen a recovery; we really see we are reinforcing that general downward trend." A paper on this topic is forthcoming. According to Comiso's study, when compared to longer term ground-based surface temperature data, the rate of warming in the Arctic over the last 20 years is eight times the rate of warming over the last 100 years. Comiso's study also finds temperature trends vary by region and season. While warming is prevalent over most of the Arctic, some areas, such as Greenland, appear to be cooling. Springtimes arrived earlier and were warmer, and warmer autumns lasted longer, the study found. Most importantly, temperatures increased on average by 1.22 degrees Celsius per decade over sea ice during Arctic summer. The summer warming and lengthened melt season appears to be affecting the volume and extent of permanent sea ice. Annual trends, which were not quite as strong, ranged from a warming of 1.06 degrees Celsius over North America to a cooling of .09 degrees Celsius in Greenland. 
The surface temperature records covering from 1981 to 2001 were obtained through thermal infrared data from National Oceanic and Atmospheric Administration satellites. The studies were funded by NASA's Earth Science Enterprise, which is dedicated to understanding the Earth as an integrated system and applying Earth System Science to improve prediction of climate, weather and natural hazards using the unique vantage point of space. Seasons of Change: Evidence of Arctic Warming Grows SYNOPSIS: Experts have long regarded Earth's polar regions as early indicators for global climate change. But until the last few years, wide ranging, comprehensive research about overall polar conditions has been challenging to conduct. Now a more than twenty-year record of space based measurements has been analyzed by researchers at NASA's Goddard Space Flight Center. Based on their findings, evidence of a warming planet continues to grow. CHANGING SEASONS, CHANGING ICE Research and data collection of Arctic Ocean ice isn't easy. But in this sequence using data collected by a number of satellites from 1979 to 2003, we see how scientists have been able to stitch together a careful record of sea ice in that part of the world. In 2002 scientists recorded the lowest concentration of sea ice ever in The Arctic. While temperature changes vary across the vast expanse of The Arctic, overall trends suggest that decreasing ice concentrations are due to a significant increase in ocean warming, from rising surface temperatures to the total number of annual "melt days". Less ice means more open water. More open water means greater absorption of solar energy. More absorption of solar energy means increased rates of warming in the ocean, which naturally tends to yield faster rates of ice loss. The data used to create these images come from a variety of different instruments flying on a group of satellites; they include the scanning multi-channel microwave radiometer attached to the Nimbus 7 satellite, and the special sensor microwave imagers attached to the Defense Meteorological Satellite Program's F8, F11, and F13 satellites. Part of the challenge for researchers was in the elimination of "bad data", from atmospheric interference to instrument calibration issues and more. One reason that data acquired by microwave detecting instruments such as those flying on the DMSP satellites is that microwaves can penetrate the cloud cover that frequently blankets the Arctic. One of the most apparent characteristics of Arctic ice is just how dynamic and complex an environment it is. Through continued research and gathering of data, scientists hope to achieve a better level of understanding about the processes at work in the cryosphere. 1979 TO 2003 SEA ICE COMPARISON These two images show a comparison of Arctic sea ice concentrations between 1979 and 2003. 1979 marks the first year that data of this kind became available in any meaningful
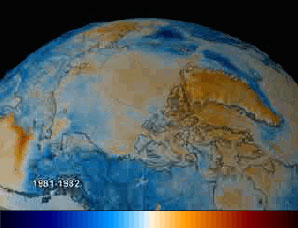
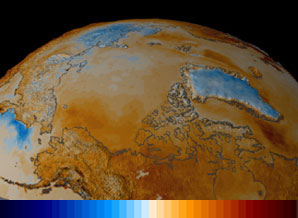
WARMER AND COOLER Space based observation facilitate a kind of thoroughness that ground based observations cannot realistically approach. Based on 20 years of data collected by infrared measurements, surface warming trends in The Arctic are eight times greater than trends over the past 100 years, suggesting a rapid acceleration in warming. According to this study, the sea ice melt season has increased by 10 to 17 days per decade. The readings are not uniform,
however. While average temperatures are increasing throughout
The Arctic, there are several places where there appear to be
cooling trends. Greenland is a good example; the data there suggest
a mild decrease in average temperatures through the time period
being analyzed. PRESSURE TO CHANGE Taken in isolation, one year's worth of data does not tell us much. Just as we all know that some days of the year might be unusually hot or cold, we intuitively understand that dramatic events in isolation are simply anomalies. But many samples of data can imply change. Taken as collections of information, trends begin to emerge based on a pattern. In this sequence we see how 21 years of accumulated data indicate temperature trends in the Arctic. While the overall direction of the trend suggests warming for the region, there are many places where the average temperature is falling year after year. BRIGHT WHITE REFLECTS LIGHT - THE GLOBAL ROLE OF THE POLAR CAPS The polar caps not only hold much of the planet's total fresh water, but also play an important role in regulating the Earth's temperature. The relevant characteristic is called albedo. It's a measure of how much radiation, or light, is reflected from a body. Similar to how a white shirt helps keep a person cooler in the summer than a black shirt, the vast stretches of polar ice covering much of the planet's top and bottom reflect large amounts of solar radiation falling on the planet's surface. Were the ice caps to appreciably recede, sunlight that otherwise would have been reflected back into space would get absorbed by the darker, denser mass of ocean and land beneath. As light is absorbed, the environment is heated, thus intensifying a feedback loop: a warmer planet yields more ice melting thus an even warmer planet. IS THE OCEAN RISING? This animation provides a closer perspective of the relationship between ice and solar reflectivity. As glaciers, the polar caps, and in this case, icebergs melt, less sunlight gets reflected into space. It is instead absorbed into the oceans and land, thus raising the overall temperature, and adding energy to a vicious circle. Of the many concerns voiced by scientists who study global warming trends, rising ocean levels is one of the most dramatic. An average rise in global ocean levels of just a few inches could have devastating effects on coastal towns, cities, and ecosystems. Why then is even the slightest risk of a shrinking polar cap not sounding alarms all across the world's lowland regions? It comes down to a simple principle proved thousands of years ago by the Greek philosopher and scientist Archimedes. He showed that a body, in this case the floating ice of the North Pole, immersed in a fluid, is buoyed up by a force equal to the weight of the displaced fluid. In other words, since the northern pack ice is already floating its melting would not independently cause ocean levels to rise. However, the attending planetary conditions necessary to facilitate polar melting would likely have other enormous effects on the environment. These include the likely melting of the ice sheets covering Greenland and the vast reaches blanketing southern polar cap. As the ice over Greenland and Antarctica is NOT floating, a corresponding rise in the world's sea level would almost certainly result if it melted. OBSERVATIONS FROM ABOVE- NASA'S EARTH OBSERVING FLEET From space, the whole world unfolds every day. Orbiting the planet more than ten times a day, NASA's Earth Observing Fleet is uniquely able to make the kinds of measurements that experts need to track systemic changes on the Earth below. With regard to studies about the Earth's cryosphere, several space-based systems stand out. For starters, there's the AMSR-E instrument flying on the Aqua satellite. A sensor that measures microwave emissions, AMSR-E can make precise measurements about overall snow and ice coverage to a degree never before possible. The Aqua satellite blasted into space on May 4, 2002. There's the ICESat spacecraft, launched January 12, 2003. With its one scientific instrument called GLA, ICESat continues to deliver state of the art measurements of changing surface features of worldwide ice cover. By pulsing a laser 40 times a second and measuring its reflected light, the GLAS instrument will be an important tool for tracking changes in the Arctic and elsewhere. There's an instrument called MODIS, flying on both the Terra and Aqua satellites that can determine precise color measurements of the Earth below. In terms of science, color is information, and with MODIS's superbly sensitive capabilities, fine details about terrestrial features are just now beginning to resolve. The POES spacecraft belong
to NASA's sibling agency NOAA. But using data from this Earth
observing workhorse, researchers continue to make important observations
about thermal emissions and other characteristics about the planet
below.
|
||