 September 04, 2003
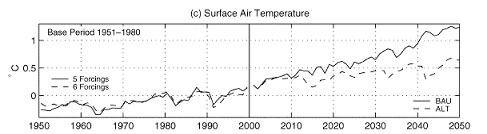
 Shan Sun and James Hansen, both of NASA's Goddard Institute for Space Studies, New York, NY, used NASA's Global Climate Model (GCM), one of the world's leading computer climate models that simulate past and potential future climate changes. The GCM has been enhanced with new "ocean models" that better simulate how oceans currently absorb heat and will respond to a warming global climate. The study appears in the latest issue of the American Meteorological Society's Journal of Climate. One of the leading reports on climate change, the Intergovernmental Panel on Climate Change (IPCC) report of 2001, suggests that between the years 1990 and 2100 the world's average temperature will rise between 0.6 and 2.5 degrees Celsius (C) or 1.1 and 4.5 Fahrenheit (F). "The enhanced GCM shows that the average global temperature would rise between 0.4 and 1.2 C (between 0.7 and 2.2 F) through the year 2050, for plausible increases of greenhouse gases," Sun said.  CREDIT: NOAA/Historic NWS Collection
The enhanced GCM showed the
world's oceans were storing heat at a rate of about 0.2 Watts
per square meter in 1951, and in the past 50 years, as atmospheric
temperatures warmed, the rate of heat storage increased to about
.75 Watts per square meter, capturing more heat from the atmosphere.
"This increase in ocean heat storage shows that the planet
is out of energy balance," Hansen said. "This energy
imbalance implies that the atmosphere and ocean will continue
to warm over time, so we will see continuing climate change."
It is important to know accurately how much heat oceans are storing, because the amount of heat stored provides a measurement of the Earths energy imbalance and indicates how
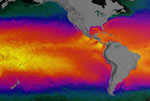
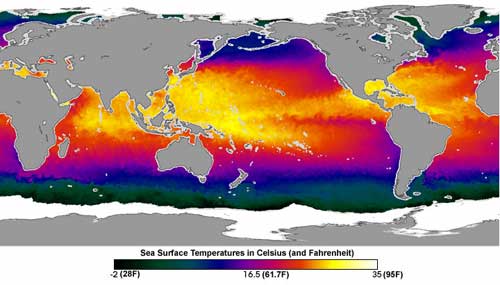
Sun and Hansen also looked at changes of precipitation and ocean currents, other factors that warmer world-wide waters may impact. If greenhouse gases continue to increase rapidly, the model projects significant ocean warming during the next 50 years in the Eastern Pacific Ocean, off the U.S. west coast, which could have biological consequences for ocean life. The results also project increased precipitation and evaporation over the North Atlantic Ocean, increasing the fresh water in the region. An increase in freshwater has long been suspected as something that could weaken the northward transport of heat by the Atlantic Ocean, thus causing Europe to become cooler, even while the world becomes warmer. Sun and Hansen find, however, that the ocean circulation does not weaken significantly according to their model, so they expect no cooling effect on Europe. More monitoring of ocean temperatures is needed to further the studies of ocean behavior. Ocean temperature readings currently do not reach full ocean depths, as is needed to increase the accuracy of future predictions. With the new Ocean Models included in the GCM, if easurements of the amount of heat held by oceans are improved, it may be possible to begin to better quantify the Earth's changing radiation imbalance and its causes with an accuracy of about one decade. This study was funded through
NASA's Earth Science Enterprise under NASA's Climate and Oceanography
Programs. The mission of NASA's Earth Science Enterprise) is
to develop a scientific understanding of the Earth system and
its response to natural or human-induced changes to enable improved
prediction capability for climate, weather, and natural hazards.
Source of News, photos & graphics:
|
||